Cafeina: first results
This is an AI translation of the original Portuguese post, Cafeína: resultados iniciais.
(AI was used as support in preparing this article: grammar and spelling review, data analysis and chart generation. But this is not an article written by AI.)
Cafeina started as a utility to stop Windows from hibernating while my queries were running, back in my “pre-Databricks” era, when my data environment was SQL Server and I reached the data through SSMS. A simple project: Python packaged into a Windows executable, a simple front end, hidden in the tray.
The first “manual” version simulated random key presses or small mouse movements. The second one, still manual but smarter, changed the system parameters to tell Windows not to shut down. My team and other colleagues started using the utility.
In September 2025 I read the news that Itaú was monitoring its employees through click tracking (and that led to some dismissals), and, as a joke, I added the first tracking of clicks and mouse travel distance on screen, so we would know how much we were using.
At that same moment the idea arrived: the same keyboard hook that counts keys could measure how I type. And the question: can I build a profile of mouse and keyboard use that identifies my usage style? If so, I could build an algorithm that, for example, locks my laptop when it detects a style of use that is not mine. Before AI it was a nice idea, but one that would take time I could not spare among the day-to-day demands. With AI, that idea can become real.
I started with a few simple measures of typing style:
- Frequency of keys pressed
- Points of mouse use on screen
- Recording of bigrams and trigrams of key sequences
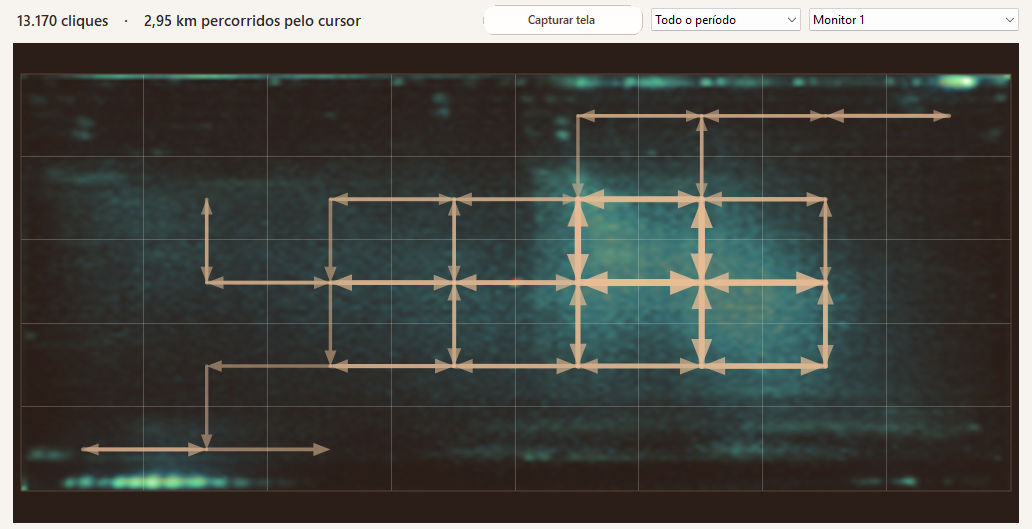
Areas of use, typical movements on screen and cursor resting points
First conclusions after a collection period:
- Mouse movement tracking depends on the hardware used, not only on the user. At home I use a widescreen monitor, at the office a smaller one. The solution was to create an “identity”, made of user plus the setup being used, as the unit of collection
- I would need to collect data from other people to run tests and compare different profiles. Solutions:
- To collect data from more people I put a backend on my server to receive data through an API. The local app sends the data
- This collected information is biometric and does allow a person to be identified (which is the point). I needed a minimum privacy policy to stay aligned with the LGPD, Brazil’s data protection law: anonymisation, and the ability for a participant to revoke consent and erase what was uploaded
- Still on privacy, neither the collection nor the upload to the server is automatic. Collection has to be switched on by the user, and every upload is done by hand, requiring the user’s consent to the privacy policy
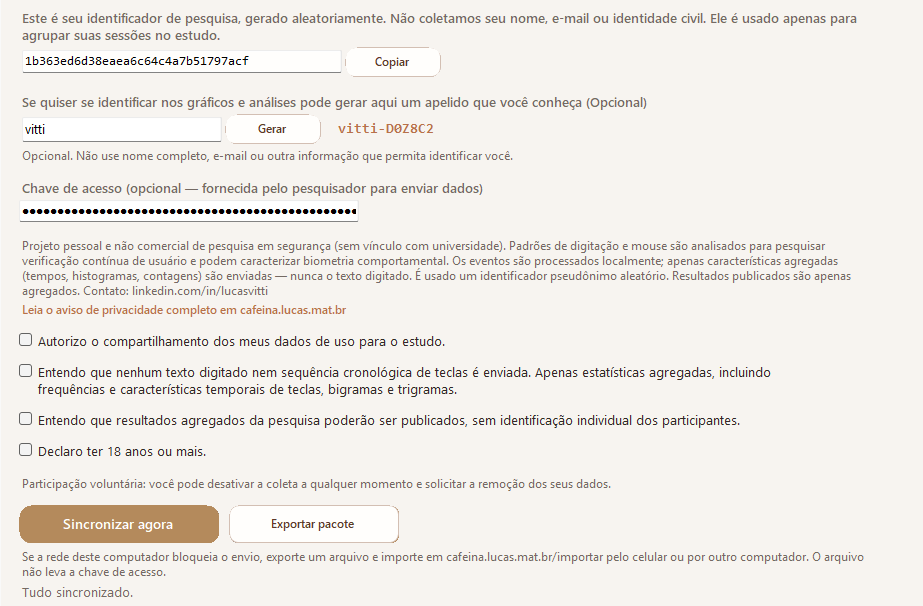
Data upload screen. It requires explicit consent on every submission of data to the research
What Cafeina collects
Three pieces of information from the keyboard.
Terminology:
- down is the moment the key is pressed
- up is the moment the key is released
| Variable | What it is | Unit |
|---|---|---|
| dwell_ms | how long a key stays pressed, from its own down to its own up | ms |
| flight_dd_ms | from one down to the next down (the key-to-key rhythm) | ms |
| flight_ud_ms | from the up of one key to the down of the next (the “gap” between them) | ms |
A bigram is an ordered pair of keys, such as (A, S). That is where flight lives: the time between the first and the second. A trigram is the same concept over a sequence of three keys.
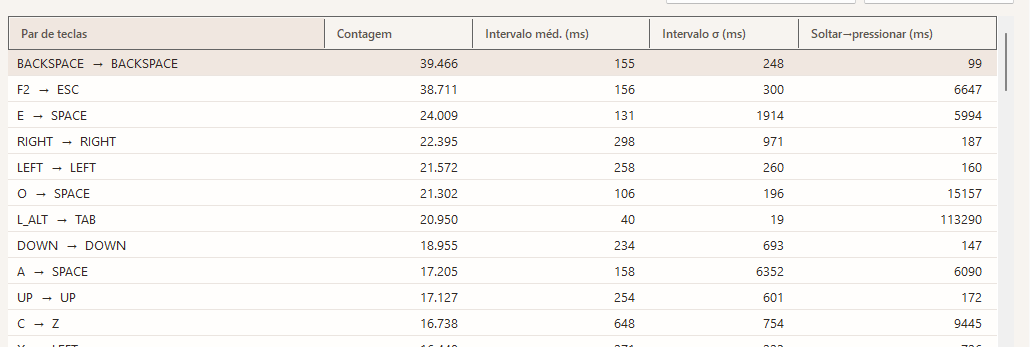
Example of bigram collection
For the mouse we collect 13 movement variables. The distance and speed measures are normalised as fractions of the screen diagonal, so they do not depend on monitor or resolution; the rest are times, counts, ratios and angles. This information was not used in this analysis, because two of the four participants run a version of the app that predates movement collection and simply do not have it.
Terminology:
- Fraction of the diagonal. Distances travelled are not measured in pixels. Each displacement is divided by the diagonal of the monitor it happened on, d = √(dx² + dy²) / diagonal. So crossing half the screen is worth 0.5 on a laptop and 0.5 on an ultrawide monitor. This does not guarantee the measure is invariant across different monitors for the same user, but it improves it
- Stroke. A continuous sequence of movement, closed when the mouse stays still for more than 150 ms. It is the natural unit of “one gesture”: grab the pointer, take it to a target, stop
Variables collected per segment, inside a stroke
| Variable | Definition | Unit | Histogram range |
|---|---|---|---|
| speed | instantaneous speed, d / dt | diagonals per second | 0 to 4 |
| accel | acceleration, the change in speed. Signed: negative when the movement brakes | diagonals per s² | -200 to 200 |
| jerk | the change in acceleration. Measures how abrupt rather than smooth the movement is | diagonals per s³ | -2000 to 2000 |
| angle | absolute direction of the segment | radians, -π to π | -π to π, 10° bins |
| turn | change of direction between one segment and the next | radians, 0 to π | 0 to π, 5° bins |
| curvature | turn / d, how much the path turns per unit of distance travelled | radians per diagonal | 0 to 500 |
Variables collected per stroke
| Variable | Definition | Unit | Range |
|---|---|---|---|
| stroke_ms | duration of the stroke | ms | 0 to 6000 |
| path_efficiency | straight-line displacement divided by the path actually travelled. It is 1 for a perfectly straight movement and falls the more the path wanders | ratio, 0 to 1 | 0 to 1 |
| micro_corrections | how many abrupt reversals (a turn greater than 135°) happened inside the stroke. It is the “I overshot the target and came back” | count | 0 to 40 |
| pause_ms | the still interval between two strokes | ms | 0 to 2000 |
Variables related to the click
| Variable | Definition | Unit | Range |
|---|---|---|---|
| click_interval_ms | time between one click and the next | ms | 0 to 3000 |
| velocity_at_click | the pointer speed immediately before the click (200 ms window). Measures whether the person stops on the target before clicking or clicks while still moving | diagonals per second | 0 to 4 |
| movement_onset_ms | the time between an input stimulus and the start of movement. It is the reaction delay before the gesture | ms | 0 to 1500 |
The data
So far the server holds 976 sessions across 4 identities, recorded between 9 August and 17 October 2026. Two of those identities are mine, my use on a personal and on a corporate computer. The other two are colleagues who agreed to take part. I know who the people are, but I have no way of telling who is who in the data.
That left 14 variables, all taken from the histograms: mean, standard deviation, median and interquartile range of dwell and of flight_dd, plus the mean dwell of six individual keys (SPACE, A, E, O, S, C). Of the 976 sessions, 438 passed the filter of having at least 200 samples of each type and the six keys with at least 20 samples each.
Each collection session is a point in a 14-dimensional space. Multidimensional scaling was applied to project that space onto a plane (standardising the variables first), to assess whether we could find clusters of use by identity. We got a good result in this first analysis.
Methodology
- Multidimensional scaling to reduce the dimensionality of the data (from 14 to 2 variables). It is not a necessary step for the goal of the study, but it is a good way to see whether we can visualise the data and the separation between identities
- 1-NN, leave-one-out. This was the first test of the hypothesis: does the collected data separate different usage identities? Conceptually the test is simple: for each session, we look for the closest one in the full 14-variable space, and check whether it belongs to the same identity. Because the data is very unbalanced (many sessions of mine, few from the other participants), instead of running on the whole base I drew 65 sessions from each of the three participants with enough volume, and repeated the draw 500 times. With three groups of the same size, guessing gets 1 in 3, that is 33%. Result: the nearest neighbour belongs to the same identity in 99.9% of cases, and never below 99.0% in any of the 500 draws. The initial hypothesis holds
- Finding the groups. Here we apply k-means to assess whether the groups appear in the data without the identity information. For each k between 2 and 6 we assess the quality of the separation by the silhouette, which for each session compares the average distance to its own group with the average distance to the nearest neighbouring group: close to 1 the session sits comfortably, close to 0 it is on the border, and negative means it is closer to another group than to its own. We compare each solution with the real identities using the adjusted Rand index (ARI), which is 1 for total agreement and 0 for what chance would give.
| k | silhouette | ARI vs identity |
|---|---|---|
| 2 | 0.549 | 0.449 |
| 3 | 0.572 | 0.531 |
| 4 | 0.539 | 0.809 |
| 5 | 0.545 | 0.786 |
| 6 | 0.387 | 0.489 |
Quality of the separation by k. The silhouette is best at k=3; agreement with the real identities is best at k=4.
Analysis
The 1-NN test came out at 99.9% accuracy. In machine learning that is a warning sign: very good results are usually indicators of methodology errors rather than of a perfect model. To work through that doubt we raised three hypotheses that could cause the effect and invalidate the study.
(H1) Temporal adjacency. The nearest session found by the 1-NN is from the same day as the session being analysed, for the same identity.
If true, the model is pointing at the next session of the same user. Two adjacent sessions have a high chance of sharing the same typing style, mouse use and user fatigue. In that scenario the conclusion to draw from the data would be that uses within the same afternoon look like one another.
The test showed this is not the case: only 5.7% of the nearest sessions are from the same day, and the median distance between a session and its nearest neighbour is 293 hours, about twelve days.
(H2) Versioning. During the development of the app, several versions of the collection format were stored. Beyond new variables, the same variable may have been measured in slightly different ways as the app evolved.
If true, the conclusion is that the separation found is a proxy for the form of measurement, not for the identity of the user.
For this test the data was restricted to version 1.7.0.0, the only one shared by all three participants. Even so the 1-NN test gives 98.8%.
(H3) Reverse test. H2 asks whether the hypothesis holds once different app versions are removed. H3 is the inverse: does the app version have any separating power at all? For this test, instead of using the identities as the 1-NN target, I use several measures of app versioning within a single user (that is, the test runs on my data only). I also included the month of collection, which serves as a control: a month cannot change the way anything is measured.
If true, that is, if within a single user the app version were easily identifiable, then version is a strong axis in this space and the separation between participants falls under suspicion again: there could be collection bias caused by the version.
| Label | 1-NN | Chance | Excess |
|---|---|---|---|
| App version | 33.2% | 23.6% | +9.6 pp |
| Collection schema version | 52.3% | 40.2% | +12.1 pp |
| Month of collection | 47.3% | 35.6% | +11.7 pp |
The app version separates almost nothing: 9.6 percentage points above chance. It does not have the strength to explain the 99.9%, and H3 does not hold either.
What remains is explaining the residual. The month of collection separates as well as the versions do, and a month does not change the way anything is measured. Since app version, schema version and month are all proxies for the same thing, time, the conclusion is that this remainder is not measurement: between September and October my typing pattern shifted. There is a natural drift, which also needs to be modelled.
With the three hypotheses discarded, we continue with the analysis. No value of k produces one group per identity. At k=3, where the silhouette is best, it merges my sessions with those of one of the participants and spends the third group separating a subset of my own sessions. At k=4, the one closest to the real labels, it still spends an entire group on that same subset.
That subset is not a second way of me typing: it is a game (literally, Hollow Knight: Silksong). In those sessions the C key stays pressed for 213 ms against my usual 68 ms, S goes from 71 to 103 ms, and SPACE, E and O do not move at all. They also have a third of the clicks per keystroke. That is WASD with crouch, not typing. The consequence is uncomfortable: along the main axis, my own variation from changing activity is larger than the distance between me and another participant.
Chart 1 shows the result: the four identities (three people, since two of the installations are mine) projected onto two dimensions. My gaming sessions show up stretching my group to the right, and the four sessions from my corporate laptop do not land near my home ones, but on the edge of another participant’s group. Too few points to conclude anything on their own, but they point towards the decision I had already taken at the start of the project: identity here is user plus setup, not user.
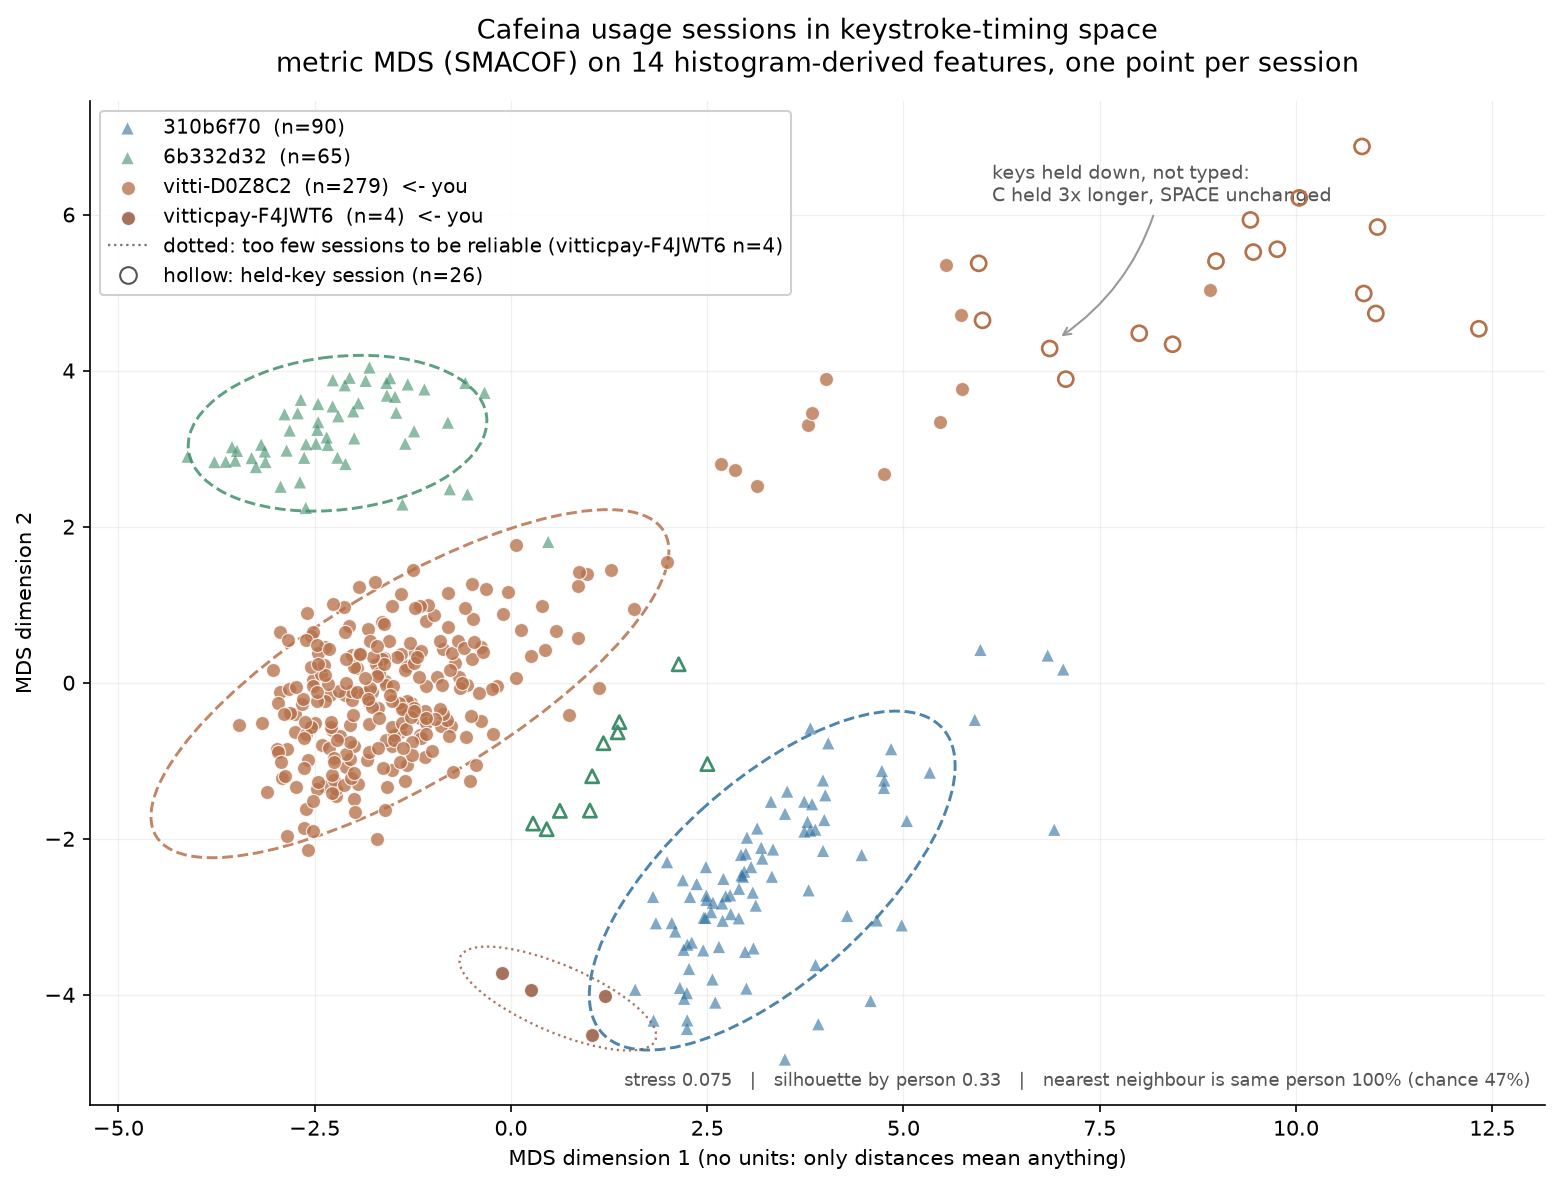
Chart 1. Each point is a session. Hollow points are the held-key sessions; the ellipses cover two standard deviations of ordinary typing only.
Conclusions
Typing rhythm, on its own, has the power to separate identities when analysing real usage data, with no task control (that is, the user does whatever they are doing, we do not know the task being performed) and with no predefined text.
Separating four known installations, however, is very different from recognising a person. Three things are mixed together in the groups: the person, the activity and the hardware. As long as changing activity moves a point more than changing person does, any system acting on “this does not look like you” would fire the moment the legitimate user opened a game.
The test is also closed: it chooses between known identities. The real problem is open, “is it you or not”, with a threshold, the option to refuse, and a stranger who never entered the base. They are different problems, and the second is much harder.
One of the ideas that motivated this analysis, having the machine lock itself when it detects divergence, does not hold up on these variables alone. The loosest rule that still detected anything locked out the legitimate user almost twice a day.
Next steps:
- Collect more data. Bring more participants into the project so we have a richer parameter space for the analyses
- Define the per-device baseline properly. The app already records which physical keyboard generated each session. The analysis did not use that information because we have too few sessions with that field filled in
- Drift. Work out how to model the drift in usage for the same user
Want to take part?
Download the app at cafeina.lucas.mat.br and get in touch with me to receive an authorisation key for uploading data.